


About the Voters Processed: Details Page
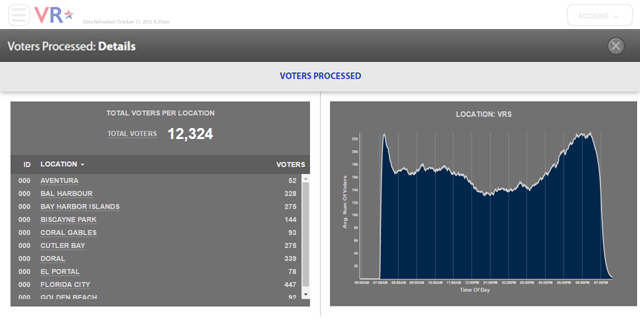
The data provided on the Voters Processed: Details page allows you to see the number of voters checked in at each polling place location across your jurisdiction. Using this information, you can monitor and report on the number of voters who have checked-in at each location. For example, you can use this information to respond to media requests with near real-time voter turnout counts, across the jurisdiction or by location.
You can also evaluate if voter turnout is higher or lower than expected for a specific location, enabling you to proactively respond to higher-than-expected voter turnout, for example, by sending extra supplies, EViDs, or election workers to assist.
The Average Voters Each Hour graph allows you to visualize the trend of voters checked in by hour for the current day across the jurisdiction or at a specific polling location. This graph displays the "exponential moving average" of the number of voters processed.
NOTE: This page displays statistics for the election selected in the Election # filter on the Dashboard. If a specific Polling Place filter is set, it is ignored. To see statistics for a different election, change the Election # filter on the Dashboard.
To access the Voters Processed page:
-
On the Dashboard, in the Voters Processed module, touch or click the
 icon next to the Total Voters
Each Hour graph.
icon next to the Total Voters
Each Hour graph.
To change the view of the Voters Processed graph:
-
To view the number of voters processed per hour for a specific polling location, touch or click the location name in the left pane.
-
To view the number of voters processed per hour for all polling place locations across the jurisdiction, touch the Total Voters number.
See Also: