


About the Voters Processed Dashboard Module
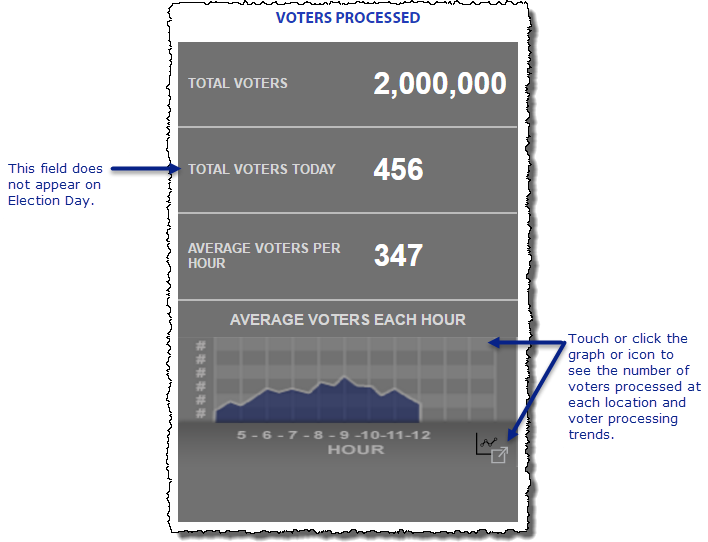
Using the Voters Processed Dashboard module you can monitor the total number of voters processed throughout Early Voting and Election Day and the average number of voters checked-in per hour. During Early Voting the module also displays the total number of voters checked in throughout early voting.
Directly below the statistics, the Average Voters Each Hour graph allows you to visualize the number of voters checked in by hour across the jurisdiction. The number of voters processed corresponds directly to the number of voters checked in on all EViDs configured for the selected election.
NOTE: Use the Election # and Polling Place filters on the Dashboard to see statistics for a different election or a specific polling place.
See Also: