


About the Wait Times Dashboard Module
The Wait Times Dashboard module graph represents the proportion of locations in each Wait Time range across the jurisdiction. Directly below the graph, statistics on the number of polling places set to each wait time value is displayed.
NOTE: Use the Election # and Polling Place filters on the Dashboard to see statistics for a different election or a specific polling place.
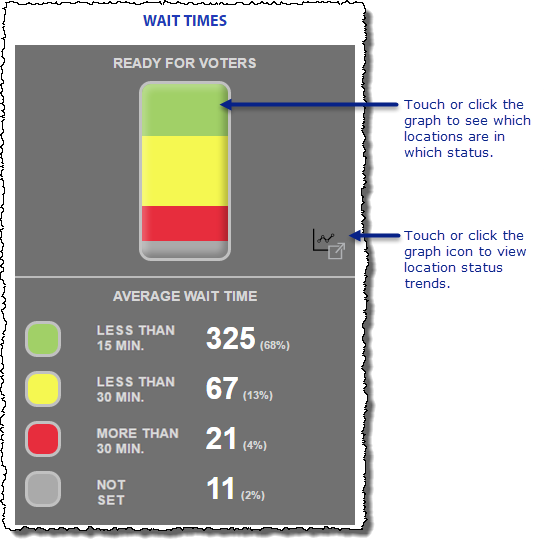
This module uses the Wait Time set on an EViD station at each polling place to determine which wait time range the location belongs in.
If a wait time is not set on at least one EViD at a polling place, the Wait Time for that location is considered "Not Set."
See Also:
Highlight Search Results
Display results with all search words
Search results per page