How Election Results Are Presented on the Website
When a citizen visits your website looking for voting data in a current or past election, they will appreciate an easy-to-find link to the election results. In addition, site content can be translated to their preferred language using Google Translator. We recommend you add a the pre-designed Election Night Results button on your homepage, embed the results on your homepage, or add a link to the ENR web service from your site menu. See Ways to Display Election Night Results on Your Website for instructions.
You have four display options for ENR:
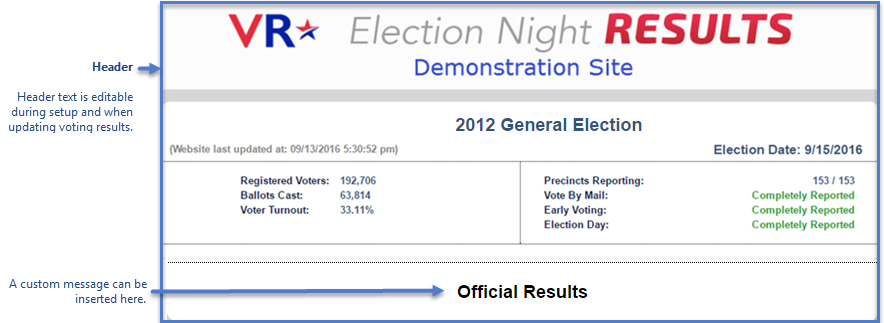
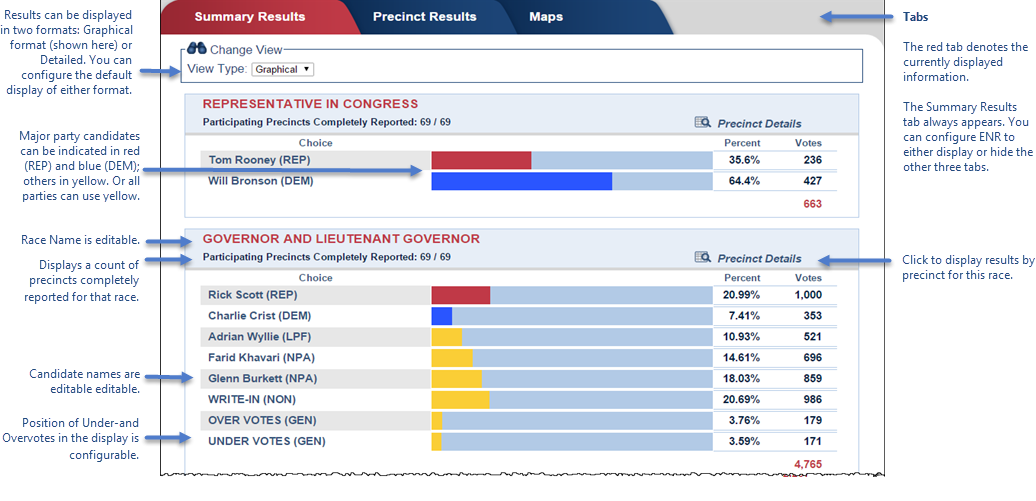
A tabbed set of results, like the screenshot below, topped by a header showing high-level statistics such as number of registered voters.
A list of the races with number of votes and percentage of votes per candidate, which scrolls vertically, designed for "war room" and media presentations. This view can be configured to show the precinct map at the bottom of the scrolling display. How Election Results Are Presented on the Website appear in the header. Scrolling speed can be controlled by the viewer using simple + and - options on the page.
Displays the same information as the Scrolling Summary Results page; however, your county banner appears at the top of the page. Scrolling speed can be controlled by the viewer using simple + and - options on the page.
Same format as the Summary Results, except the Precinct Results tab is selected as the first display.
You can also choose to display Precinct Maps:
Shows the reporting status of each precinct—Fully Reported, Partially Reported, Not Yet Reporting, or Not Participating.
Shows the percentage of voter turnout by precinct.
Shows and a display of results for a specific race.
And Reports
- Candidate Results by Precinct
- Candidate Summary Results
Example
The image below is an example of what a visitor might see when they click the link to ENR. This example is of the Summary Results view.
When comparing the example here to what’s displayed on your website, remember that what you see is a direct extract from your tabulation system election-results file. Your statistics may vary from what is shown here, because each vendor supplies different levels of information.


